Grafana Metrics Service
ObjectRocket’s new platform includes Grafana dashboards for all customers, where metrics for running instances can be viewed.
How it Works
The ObjectRocket service captures status and performance metrics for all instances running on the platform and we now offer a way for customers to view the metrics for their data stores in dedicated Grafana dashboards. As a customer on our new ObjectRocket platform, you can log in to a hosted Grafana instance with your ObjectRocket credentials and view metrics dashboards for your instances.
Login and Authentication
The Grafana dashboards use the same credentials as Mission Control, so there are a few ways to log in to our hosted Grafana instance:
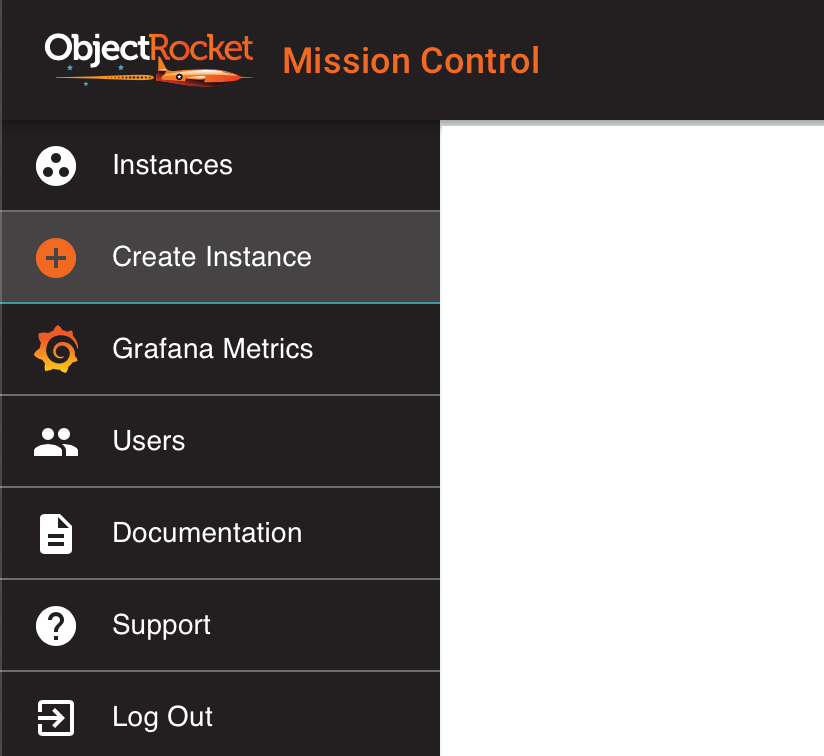
From Mission Control, click on the “Grafana Metrics” link in the main menu/sidebar. This will automatically sign you in to Grafana.
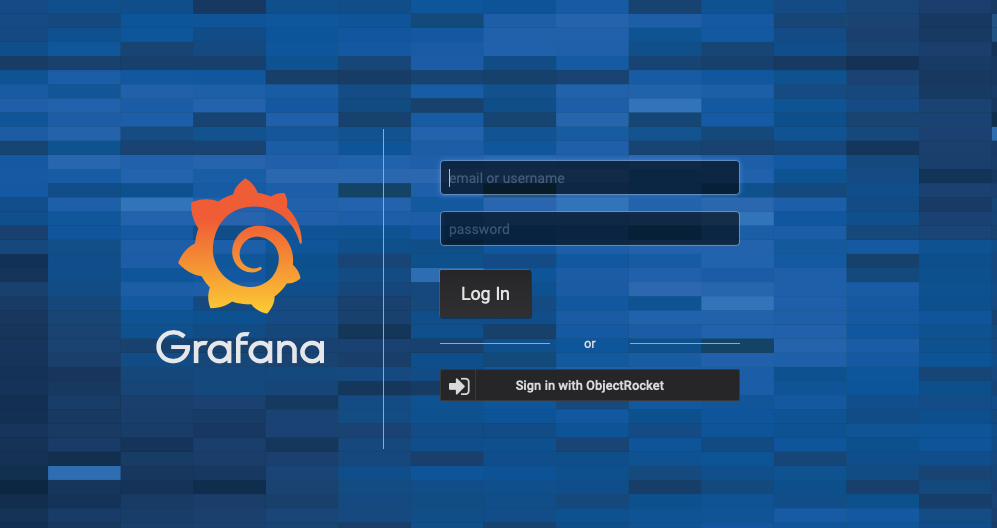
Navigate directly to https://graphs.launchpad.objectrocket.cloud/. From there, click on the “Sign In with ObjectRocket” button. If you’re already signed in to Mission Control, this will automatically authenticate your credentials and log you in. If you’re not, you will then be asked to enter your Mission Control credentials to log in.
How to View Metrics
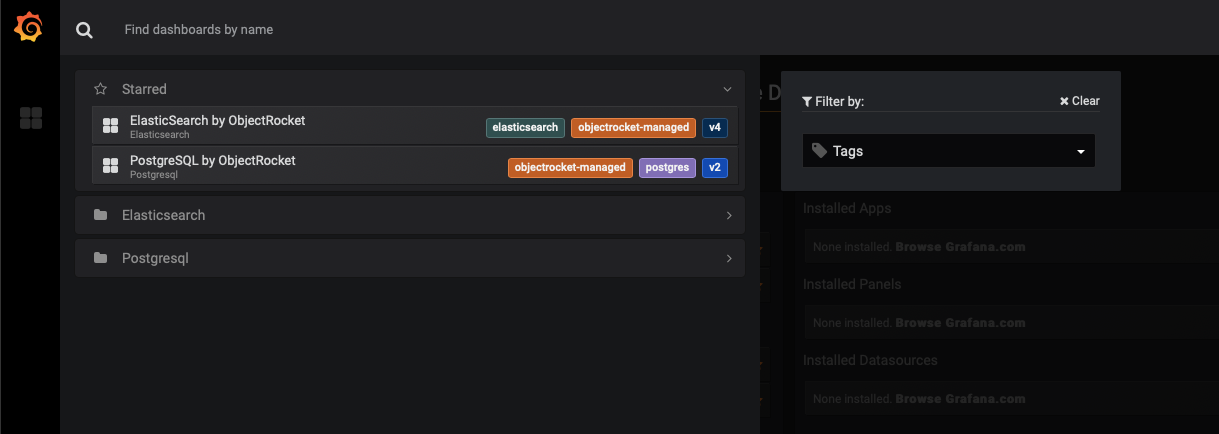
When you sign in to Grafana, you start at the “Home” page. From this page, you can view recent or starred dashboards.
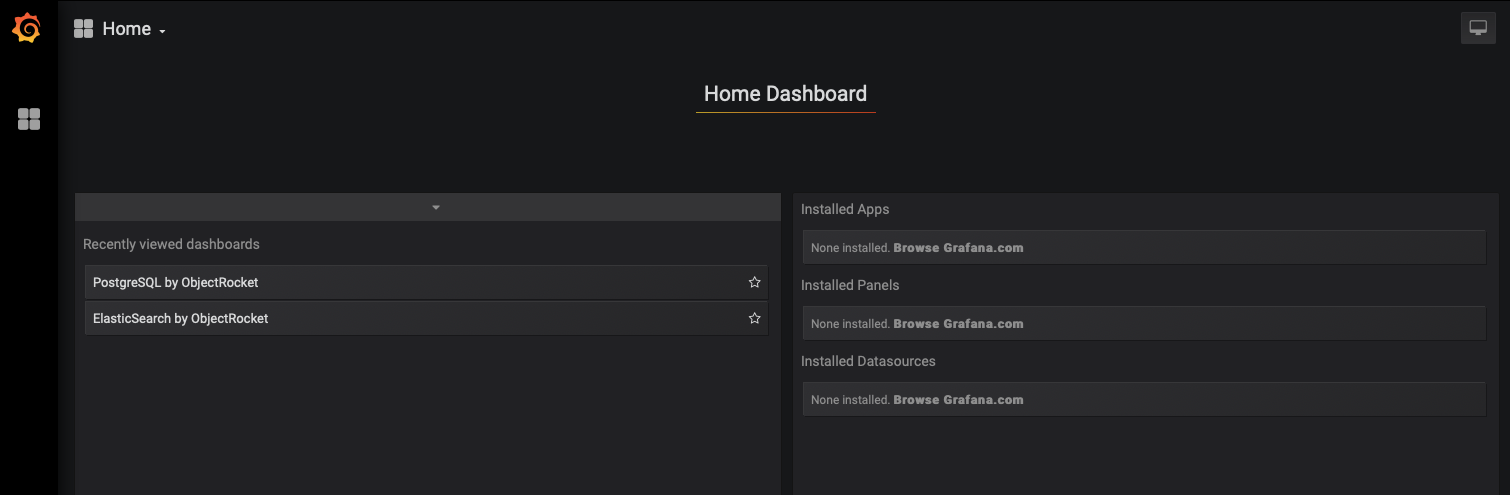
However, if it’s your first time, you’ll need to click where it says “Home” to see the list of available dashboards, separated in folders by product type.
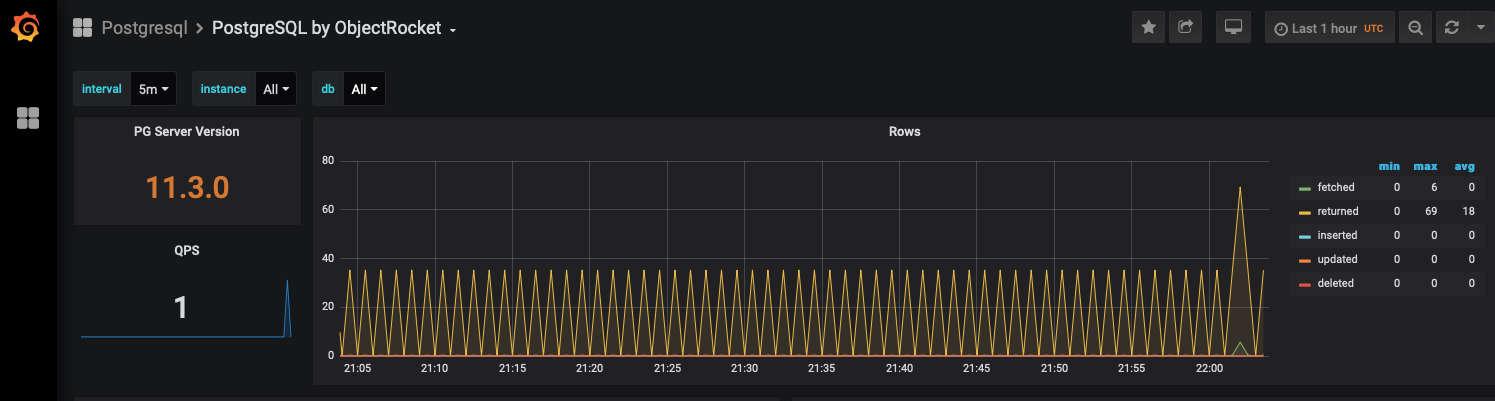
Once you’ve selected a dashboard, you’re then presented with filters to narrow down your metrics by instance.